Commonly used Verbs in Science
Account/Account for: state reasons for, report on
Analyse: Identify components and the relationship between them; draw out and relate implications
Assess: Make a judgement of value, quality, outcomes, results or size
Clarify: Make clear or plain
Compare: Show how things are similar or different
Contrast: Show how things are different or opposite
Critically (analyse/evaluate): Add a degree or level of accuracy depth, knowledge and understanding, logic, questioning, reflection and quality
Deduce: Draw conclusions
Define: State meaning and identify essential qualities
Demonstrate: Show by example
Describe: Provide characteristics and features
Discuss: Identify issues and provide points for and/or against
Evaluate: Make a judgement based on criteria; determine the value of
Examine: Explain or relate cause and effect; make the relationships between things evident; provide why and/or how
Explain: Relate cause and effect; make the relationships between things evident; provide why and/or how
Identify: Recognise and name
Interpret: Draw meaning from
Justify: Support an argument or conclusion
Outline: Sketch in general terms; indicate the main features of
Predict: Suggest what may happen based on available information
Recall: Present remembered ideas, facts or experiences
ACCURACY, RELIABILITY and VALIDITY
For data sources:
ACCURACY - a measure of HOW CLOSE your data is to the true value. Accuracy can be improved by using appropriate scientific equipment to measure the dependent variable e.g. using a stopwatch rather than estimating by counting to measure the time taken for a chemical reaction.
RELIABILITY - a measure of HOW REPEATABLE your results are - if your experimental data is reliable, you will be able to do the same experiment multiple times and obtain very similar values. Reliability in an experiment can be improved/demonstrated by having multiple repeats.
VALIDITY - a measure of whether the Aim / Hypothesis has been tested fairly (e.g. ALL variables other than the independent and dependent have been controlled = 'controlled variables') AND has correctly tested the stated hypothesis. Validity can be improved via careful experimental design that considers all of the appropriate controlled variables. The method must contain steps that allow for the appropriate collection of data.
For secondary sources:
ACCURACY - is the information true or made up?
RELIABILITY - how consistent is the information with information from other reputable sources such as scientific journals, textbooks and government websites?
VALIDITY - do the findings relate to the hypothesis (or problem), is the publication recent and have they interpreted the relevant data correctly, is the publisher qualified in a relevant field?
Skills Revision for Assessing Reliability and Validity of Secondary Sources
Not all information on the internet is made the same. Sites such as Wikipedia, Answers.com and many forums are not appropriately peer-reviewed and therefore are more likely to contain inaccurate or misleading information.
When searching for secondary sources it is important to consider the following:
- Who has published the information?
- How recently was the information published?
- Is the information consistent with other published information?
- Is the information supported by valid first-hand data?
Information is more likely to be accurate if the secondary source is valid and reliable. We can evaluate the validity and reliability of secondary sources by answering the following questions:
Evaluating Validity:
- Is the author qualified in a relevant field (we can often tell from the website e.g. websites ending in .edu .gov .org tend to be better choices than those ending in .com etc
- Is the publication recent and has any first-hand data been interpreted correctly
- Does the information in the source relate to the problem / question that you are investigating
- Is the information supported by valid first-hand data (e.g. scientific journal articles are referenced)
Evaluating Reliability:
- Is the information consistent with information from other reputable sources such as scientific journals, textbooks and educational websites?
Activity:
Work in pairs or small groups and discuss the reliability and validity of the following sources. You should be able to state whether or not you think the sources are reliable / valid and then give reasons to support your decision.
Source One
Source Two
Source Three
Source Four
The difference between DEPENDENT, INDEPENDENT & CONTROLLED variables:
DEPENDENT VARIABLE - this is the one that you measure in your experiment.
For the purpose of explanation, let's assume you're conducting an experiment to determine whether plants grow taller in the light or dark.
In the example, this is how tall the plant grows. You would measure this throughout your experiment using a ruler. On a graph, this variable would be plotted on the y-axis and in a table, this data goes into the second column.
INDEPENDENT VARIABLE - this is the one that you change in your experiment.In the example, this is the amount of light. On a graph, this variable would be plotted on the x-axis. If you took measurements every day for a week, you would plot a line graph with two lines (one line for the plant in the dark and one line for the plant in the light). If you only took one measurement at the END of a week, you would draw a column graph because there is no continuous data. In a table, this data goes into the first column.
CONTROLLED VARIABLE(/S) - these (there is usually more than one) are the ones you keep the same to make the test fair.
In the example, these could include the amount of water, temperature, type of plant, type of soil etc. Not controlling the required variables is comparable to having a race to see who is fastest, except that one person is given a head start - it's not fair.
What a "CONTROL" is:
CONTROLS - Be aware that 'controls' are VERY DIFFERENT to 'controlled variables'. A control is something that you compare your results to in an experiment.
They are used when you are conducting comparisons. For example, if you were to test the effectiveness of different fertilisers on plant height, you would need to measure the height of a plant with no fertiliser throughout the experiment to compare against the plants with different types of fertiliser to validly test (see definition below) which was most effective.
THINK: If you wanted to test whether a fingernail growth polish really made your nails grow faster, how could you tell if the product was effective if you painted all of your nails??? You have nothing to compare the nail polish-induced growth to! You would need to paint the nails on one hand ONLY so that you had your other nails to compare the nail polish-induced growth against normal growth (a CONTROL!)
Important Skills for SRP
Scientific Reports usually contain the following headings:
TITLE
AIM
BACKGROUND INFORMATION
HYPOTHESIS
LIST OF VARIABLES
MATERIALS
RISK ASSESSMENT
METHOD
RESULTS
DISCUSSION
CONCLUSION
REFERENCES
Let's look at each section individually
TITLE
AIM
BACKGROUND INFORMATION
HYPOTHESIS
LIST OF VARIABLES
MATERIALS
RISK ASSESSMENT
METHOD
RESULTS
DISCUSSION
CONCLUSION
REFERENCES
Let's look at each section individually
1) Aim
Your aim should connect the independent and dependent variables in your experiment.
You need to start your aim with the word ‘To’ followed by a verb, such as ‘determine’, ‘investigate’ or ‘measure’ etc.
A template to use would be: To determine the effect of (independent variable) on (dependent variable)
2) Hypothesis
Hypothesis is written BEFORE the experiment is conducted. Hypothesis is an EDUCATED GUESS at what could happen. Hypotheses are used to make PREDICTIONS of the experiment. When writing an hypothesis, you should mention and connect the independent and dependent variable.
It doesn't matter if your experiment does not prove your hypothesis. In the discussion section, you must state if your hypothesis was supported or refuted (disagreed with).
3) Variables
The independent variable is the variable that the experimenter changes
The dependent variable is the variable that the experimenter will measure
Controlled variables are all the variables the must be kept the same so that the experiment is a fair and valid test.
Complete this Activity on Writing Hypotheses and Identifying Variables
4) Equipment List
Make sure that the exact number of equipment, size of equipment and the quantities of all substances is provided. For example:
5 x 250 mL beakers - not 5 small beakers
350 g of iron filings
Make sure that the exact number of equipment, size of equipment and the quantities of all substances is provided. For example:
5 x 250 mL beakers - not 5 small beakers
350 g of iron filings
5) Risk Assessment
* provide at least three risks and their ASSOCIATED precaution.
* a risk is the harm that could be caused. For example: burns from spilling hot liquid on skin
* the associated precaution is what the experimenter can do to prevent the risk from occurring. For the risk above, the precaution would be to be careful when pouring the hot liquid and place the container of hot liquid in the middle of the bench to avoid it being accidentally knocked over.
|
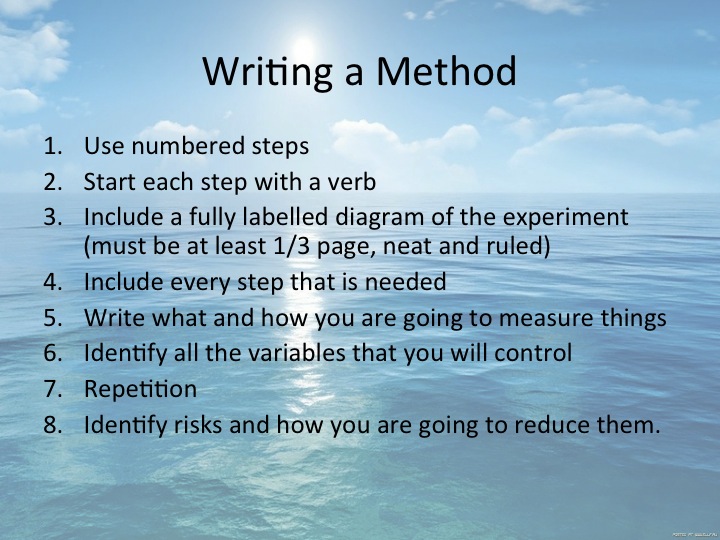
6) Writing a Method
|
|
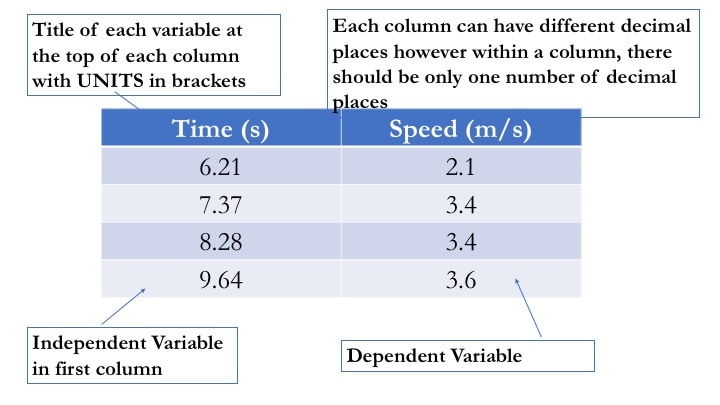
7) Drawing a Table Scientifically
|
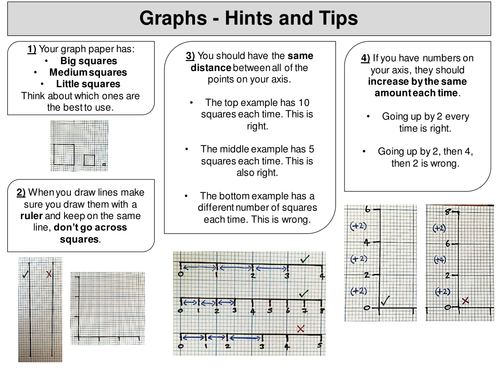
* Drawing the Proper Type of Graph for your data
Read this information if you are unsure about drawing graphs |
|
Further Data Anaylsis Practice
1) Year 10 Skills Practice - questions and answers
2) Final Skills Practice - questions and answers
NB: For the final skills practice Q 2 the Figure 9.2.5 is difficult to read. The first column is the amount of fertiliser added to the three different plants, the second column is the height of the plants at day 0 and the next column is the height of the plants on Day3, then Day 4, then day 5, Day 6 and finally Day 7
