|
Resources for improving Data Analysis
A) Learn the commonly used verbs in Science B) Drawing Tables C) The Types and Drawing Graphs D) Three Skills Sets to practice |
|


|
A) Learn the commonly used Verbs in Science
It is very important to understand what the verb means in the question. You should regularly read through this list and refer to it when answering questions to make sure that you have structured your response correctly Account/Account for: state reasons for, report on Analyse: Identify components and the relationship between them; draw out and relate implications Assess: Make a judgement of value, quality, outcomes, results or size Clarify: Make clear or plain Compare: Show how things are similar or different Contrast: Show how things are different or opposite Critically (analyse/evaluate): Add a degree or level of accuracy depth, knowledge and understanding, logic, questioning, reflection and quality Deduce: Draw conclusions Define: State meaning and identify essential qualities Demonstrate: Show by example Describe: Provide characteristics and features Discuss: Identify issues and provide points for and/or against Evaluate: Make a judgement based on criteria; determine the value of Examine: Explain or relate cause and effect; make the relationships between things evident; provide why and/or how Explain: Relate cause and effect; make the relationships between things evident; provide why and/or how Identify: Recognise and name Interpret: Draw meaning from Justify: Support an argument or conclusion Outline: Sketch in general terms; indicate the main features of Predict: Suggest what may happen based on available information Recall: Present remembered ideas, facts or experiences |
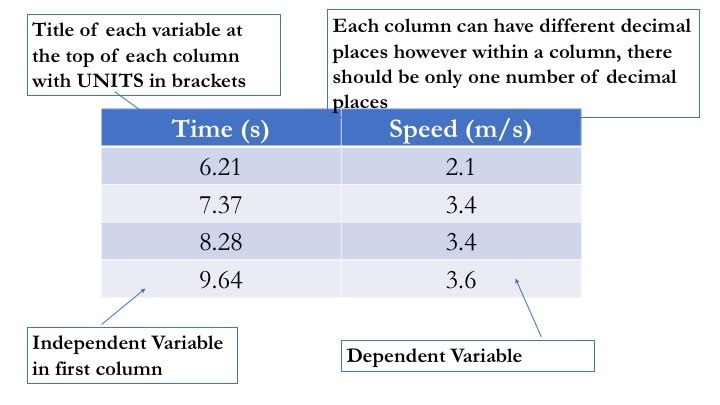
B) Drawing Tables
|
D) Three Skills sets to practice
Resources for Conducting Practical Assessment Tasks
A) Writing Scientific Reports
Scientific Reports usually contain the following headings:
AIM
HYPOTHESIS
VARIABLES
EQUIPMENT LIST
RISK ASSESSMENT
METHOD
RESULTS
DISCUSSION
CONCLUSION
Let's look at each section individually
AIM
HYPOTHESIS
VARIABLES
EQUIPMENT LIST
RISK ASSESSMENT
METHOD
RESULTS
DISCUSSION
CONCLUSION
Let's look at each section individually
1) Hypothesis
Hypothesis is written BEFORE the experiment is conducted. Hypothesis is an EDUCATED GUESS at what could happen. Hypotheses are used to make PREDICTIONS of the experiment. When writing an hypothesis, you should mention and connect the independent and dependent variable.
It doesn't matter if your experiment does not prove your hypothesis. In the discussion section, you must state if your hypothesis was supported or refuted (disagreed with).
2) Variables
The independent variable is the variable that the experimenter changes
The dependent variable is the variable that the experimenter will measure
Controlled variables are all the variables the must be kept the same so that the experiment is a fair and valid test.
Complete this Activity on Writing Hypotheses and Identifying Variables
3) Equipment List
Make sure that the exact number of equipment, size of equipment and the quantities of all substances is provided. For example:
5 x 250 mL beakers - not 5 small beakers
350 g of iron filings
Make sure that the exact number of equipment, size of equipment and the quantities of all substances is provided. For example:
5 x 250 mL beakers - not 5 small beakers
350 g of iron filings
4) Risk Assessment
* provide at least three risks and their ASSOCIATED precaution.
* a risk is the harm that could be caused. For example: burns from spilling hot liquid on skin
* the associated precaution is what the experimenter can do to prevent the risk from occurring. For the risk above, the precaution would be to be careful when pouring the hot liquid and place the container of hot liquid in the middle of the bench to avoid it being accidentally knocked over.
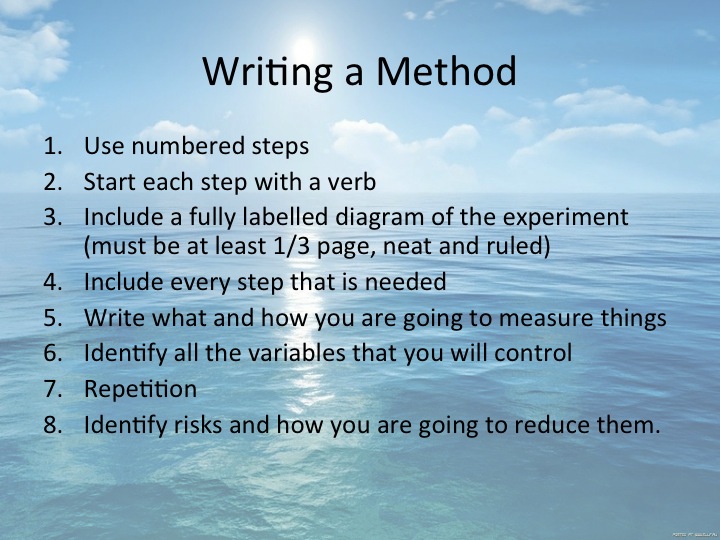
5) Method:
|
|
Complete this activity "Writing Hypotheses and Designing Methods"
6) Results
The results section can have OBSERVATIONS, TABLES and GRAPHS. You can DESCRIBE what you have observed but DO NOT EXPLAIN
The results section can have OBSERVATIONS, TABLES and GRAPHS. You can DESCRIBE what you have observed but DO NOT EXPLAIN
A) Drawing Tables
Tables must have the correct headings with UNITS in the heading. Complete the following activity "Drawing and Interpreting Tables"
Tables must have the correct headings with UNITS in the heading. Complete the following activity "Drawing and Interpreting Tables"
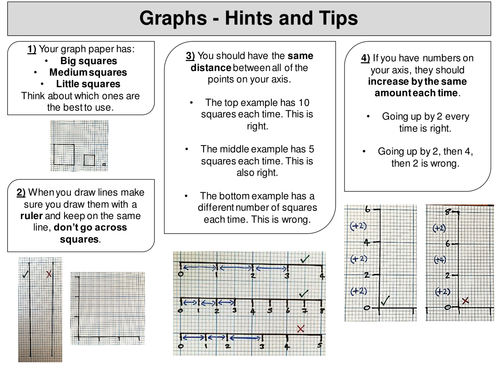
B) Drawing Graphs
Data obtained from experiments must be placed in tables and often are then used to create a graph so investigators can clearly see patterns/trends in the data. There are various different types of graphs used in Science which students must learn.
i) Read " Core Science Stage 4 Section 17.6) Presenting Your Results" and complete the six questions in the activity at the end of the section.
ii) Extra graphing questions
7) Discussion
ACCURACY, RELIABILITY and VALIDITY
For data sources:
ACCURACY - a measure of HOW CLOSE your data is to the true value. Accuracy can be improved by using appropriate scientific equipment to measure the dependent variable e.g. using a stopwatch rather than estimating by counting to measure the time taken for a chemical reaction.
RELIABILITY - a measure of HOW REPEATABLE your results are - if your experimental data is reliable, you will be able to do the same experiment multiple times and obtain very similar values. Reliability in an experiment can be improved/demonstrated by having multiple repeats.
VALIDITY - a measure of whether the Aim / Hypothesis has been tested fairly (e.g. ALL variables other than the independent and dependent have been controlled = 'controlled variables') AND has correctly tested the stated hypothesis. Validity can be improved via careful experimental design that considers all of the appropriate controlled variables. The method must contain steps that allow for the appropriate collection of data.
8) Conclusion
